How Many Software Developers Are There Worldwide in 2026?
Explore the global software developer population, how SoftLinked estimates it for 2026, and what the figures mean for education, careers, and policy.

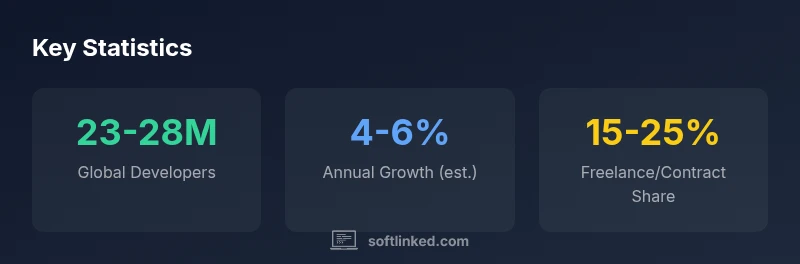
Current estimates place the global software developer population at roughly 23 to 28 million in 2026, depending on definitions and methodology. This range covers full-time professionals, part-time developers, freelancers, contractors, and coding-focused students who actively write software. Differences across surveys stem from counting methods, regional coverage, and whether adjacent roles are included.
Global context and definition of a software developer
Software development is a global activity with a broad frontier of roles that continually shift as technology evolves. When people ask how many software developers exist, they’re really asking how we define a developer and what data sources count. If you include only full-time professional software engineers employed by firms, the number will be smaller than if you also count part-time programmers, self-employed developers, researchers who code, and students who actively write software as part of training. Additionally, freelancers and contractors who work on code bases often identify as developers, further expanding the pool. The lack of a single universal definition means estimates vary widely across surveys and reports. For planning, education, and policy, it’s crucial to specify who is included: language-focused programmers, software engineers, mobile app developers, back-end engineers, or data engineers. In practice, most credible estimates converge on a multi-million-scale figure rather than a precise tally.
How SoftLinked estimates the global population
SoftLinked adopts a triangulated estimation approach designed to be transparent and reproducible. We combine publicly available industry reports, professional association data, and anonymized survey inputs that reflect both employed developers and independent coders. Our methodology explicitly documents inclusion criteria (employment status, engagement level, and coding activities), geographic coverage, and time frame. By comparing multiple data sources and performing sensitivity analyses around definitions, we generate a plausible range rather than a single point estimate. This approach helps planners understand the spectrum of possibilities and reduces the risk of overclaiming precision in a field where definitions differ across regions and sectors.
Why estimates vary: definitions, method, and scope
Two primary frictions drive variation in global developer counts: who counts as a developer, and how the data are gathered. Some surveys count only people employed as software developers, while others include freelance developers, researchers who code, and students who write software as part of coursework. Data collection methods differ as well: cross-sectional surveys can miss part-time contributors, and regionally biased samples may over-represent certain economies. Currency and time horizon matter too—some estimates capture a snapshot, others a rolling multi-year view. Finally, double counting can occur when individuals participate in more than one coding activity or job. In analysis, these factors create a broad range rather than a precise total, which is why transparent methodology is essential.
Regional and demographic patterns (high-level)
Geographic dispersion matters for labor markets and policy. Most credible estimates indicate a sizable share of developers in regions with large tech ecosystems, with notable concentrations in Asia-Pacific, North America, and Europe. Urban centers and outsourcing hubs attract both full-time engineers and remote contractors, broadening the geographic footprint of software development. Demographic factors—such as education access, language, and local tech infrastructure—shape the supply side. While we refrain from over-claiming exact regional shares in this article, it is clear that the global developer workforce is not evenly distributed and that regional demand for talent remains a key driver of both migration and remote-work patterns.
Growth drivers and future outlook
Digital transformation, cloud adoption, and the rise of AI-assisted development are expanding the potential developer pool in several ways. More people gain access to programming education through online platforms, bootcamps, and university curricula, accelerating the pipeline. Parallelly, the demand for software across industries—from fintech to healthcare—fuels expansion and diversification of roles. Yet, the supply side faces bottlenecks: limited access to trained instructors, regional disparities in schooling quality, and geographic labor mobility barriers. The net effect is a persistent upward trajectory in the number of developers, albeit with regional variability and ongoing shifts in skill demands and tooling.
Education, training, and the developer pipeline
Preparing the next generation of developers hinges on accessible, quality education. Core topics include programming fundamentals, software engineering practices, version control, testing, security, and modern architectures. Beyond formal degrees, practical projects, internships, and mentorship accelerate readiness for industry roles. Lifelong learning remains essential as new languages, frameworks, and platforms emerge. Employers increasingly value demonstrable competence and portfolio work, making project-based learning a practical route for career entry. Policymakers and educators can bolster the pipeline through funding, accreditation, and industry partnerships that align curricula with real-world demand.
Interpreting numbers for career planning
For individuals planning a software career, the key takeaway is to use ranges rather than fixating on a single number. Context matters: your region, chosen specialty (frontend, backend, data engineering, devops, AI), and whether you intend to work for a company or freelance shape opportunities. When comparing countries or programs, examine the data definitions and methodology behind estimates. In practice, universities, coding bootcamps, and professional networks can provide more actionable signals about demand in specific locales and skill areas than global totals alone.
Data quality and uncertainty: what to watch for
No single source captures every developer, and many estimates hinge on voluntary responses, self-identification, or sampling frames that miss certain groups. When evaluating numbers, look for explicit definitions, geographic coverage, time horizon, and inclusion criteria. Cross-validation with multiple sources improves credibility. The SoftLinked approach emphasizes transparency: we publish the definitions used, the data sources, and the limitations to help readers gauge how much trust to place in any given figure.
Practical takeaways for learners and policymakers
- Define scope before citing totals in reports or discussions. A clear rubric improves comparability.
- Use ranges to summarize global scale and supplement with local data for planning.
- Invest in education pipelines and lifelong learning programs to align with evolving demand.
- Apply transparent methodology to support better decisions in workforce development and technology policy.
Global software developer estimates and methodological variants (SoftLinked Analysis, 2026)
| Source / Year | Estimated Developers (millions) | Notes |
|---|---|---|
| SoftLinked Analysis, 2026 | 23-28 | Global estimate using multiple data sources and definitions |
| SoftLinked Analysis, 2026 (Freelance mix) | 24-29 | Inclusive approach capturing freelancers and part-timers |
| SoftLinked Analysis, 2026 (Exclude students) | 21-25 | Conservative estimate excluding student coders |
Your Questions Answered
What counts as a software developer?
Counts depend on definitions chosen by a study. Some include only full-time employees; others add freelancers, part-timers, students, and researchers who code. Clarifying the scope is essential for meaningful comparisons.
Counts depend on definitions. Include freelancers and students if you want a broader view.
Why are estimates so variable?
Different surveys use different inclusion criteria and data sources. Sampling methods, regional focus, and whether part-time or student programmers are counted all impact the final number.
Different methods and scopes create a range of numbers.
How should I interpret a global developer count for planning?
Treat the figure as a range reflecting definition and data source. Use local data to inform decisions about hiring, education programs, and policy.
Think in ranges and tailor data to your region.
Does remote work affect developer counts?
Remote work expands the potential talent pool beyond geographic boundaries, but most estimates still count anyone who codecs as developers, regardless of location. The impact is more on distribution than on total size.
Remote work broadens where developers live and work, not just how many there are.
What regional differences matter most?
Regions with large tech ecosystems tend to have higher counts and faster growth, but data quality and definitions differ. APAC, Europe, and North America are commonly highlighted areas to watch.
Look at regional tech ecosystems and education access.
“Counting software developers hinges on clear definitions and consistent methodology. Without them, estimates drift across surveys.”
Top Takeaways
- Define scope clearly; inclusion criteria drive totals.
- Expect multi-million ranges, not a single figure.
- Regional trends shape supply, policy, and education needs.
- Education pipelines influence future growth and readiness.
- Use transparent methodology for actionable estimates.