Why is Software Down? A Troubleshooting Guide for 2026
An urgent, practical guide to diagnose and fix software downtime, with a step-by-step diagnostic flow, common root causes, and prevention tips for resilient systems.

The most likely cause of downtime is an infrastructure failure, such as a server outage, database crash, or network issue. Start by checking status dashboards and incident notifications, then verify recent deployments and config changes. If users report intermittent access, isolate components, test health endpoints, and rollback as necessary today.
Why is software down? Common explanations and the SoftLinked perspective
Why is software down is a question every on-call engineer dreads, but frames a practical approach: focus on the triad of infrastructure, deployment, and data integrity. According to SoftLinked, downtime often stems from predictable infrastructure hiccups or recent release mistakes. This section walks through how to interpret alerts, locate the fault, and prioritize fixes in a way that minimizes customer impact. By treating downtime as a structured incident rather than a panic event, teams can accelerate recovery and reduce repeat issues. The goal is not perfection but rapid restoration with clear ownership and evidence-driven decisions. A disciplined start is essential because even small misconfigurations can cascade into widespread outages.
Immediate checks you can perform right now
When you’re staring at an outage, begin with fast, high-impact checks. Confirm the incident is real (not a false alert) by cross-referencing monitoring dashboards, error budgets, and user reports. Check the health endpoints of critical services and verify recent deployment logs for anomalies. Review DNS and load balancer status to ensure traffic is reaching the correct endpoints. If you have feature flags, ensure they’re in an expected state. Document every finding in real time so the on-call rotation stays aligned, and don’t forget to communicate clearly with stakeholders about scope and next steps.
Diagnostic mindset: build a reliable troubleshooting flow
Adopt a repeatable diagnostic flow rather than ad-hoc fixes. Start with containment: confirm scope, identify the impacted tiers (frontend, API, database, or external services), and establish a temporary workaround if possible. Move to root-cause analysis by checking recent changes, deploys, and incidents. Use health checks and traces to isolate failing components, then validate a fix in a controlled environment before rolling it out. A calm, methodical approach reduces guesswork and speeds up recovery. Remember to keep end-users informed with honest timelines and progress updates.
Common root causes to test first: infrastructure, deployments, and data
Most outages originate from three pillars: infrastructure, deployments, and data integrity. Infrastructure issues include server outages, power or cooling problems, and network interruptions. Deployment-related outages stem from faulty rollouts, misconfigured services, or cascading changes across the stack. Data problems—such as database corruption, replication delays, or stale caches—can cripple services even when application code is healthy. SoftLinked analysis shows that systems with layered monitoring, safe deployment practices, and robust retry logic recover faster. In practice, verify each pillar: check server health, review recent deploys, and inspect database logs for anomalies. If you identify a single failing pillar, you’ll know where to focus your remediation efforts.
Triage and stabilization: turning alerts into actions
Stabilization is about turning chaos into clarity. Prioritize user-visible symptoms, then implement a minimal viable fix to restore service while you investigate root causes. Enable controlled traffic rerouting if a region or component is suspected to be the bottleneck. Turn on extended logs or tracing for affected services, but avoid overwhelming the system with extra data. Establish a status page update cadence and appoint a single incident commander to reduce confusion. By documenting decisions and outcomes, you create a traceable path for postmortems and future prevention.
Step-by-step remediation path for the top cause: a practical remediation walkthrough
The top cause—an infrastructure or deployment fault—follows a common remediation pattern: revert to a stable baseline, re-run health checks, validate service recovery, and then reintroduce changes gradually. If a rollback is viable, do so with a clear rollback plan and test in a controlled environment. After restoring services, monitor critical metrics, confirm user reports improve, and assess if the incident is fully resolved. Finally, conduct a postmortem to extract lessons and tighten the runbook for future incidents.
Prevention: building resilience to minimize downtime in the future
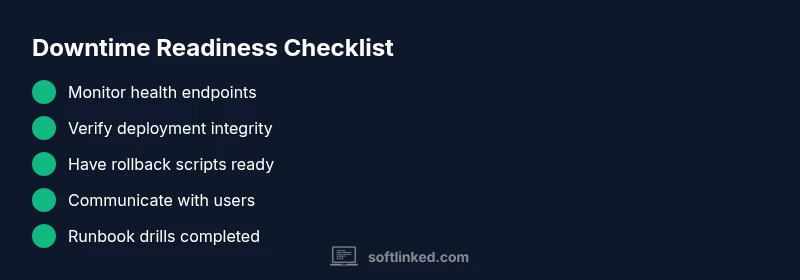
Prevention hinges on proactive monitoring, architecture that tolerates failures, and well-practiced incident response. Invest in redundant services, circuit breakers, and health-check-driven deployments. Regularly rehearse runbooks, perform chaos testing, and continuously improve alerting to reduce noise. Foster a blameless culture that values data-driven improvements and timely communication with customers. By institutionalizing these practices, teams shorten recovery times and decrease the likelihood of repeated outages.
Communicating during downtime: transparency, timelines, and stakeholder trust
During outages, clear, timely communication is as important as the fix itself. Provide honest, customer-facing updates with scope, impact, and expected resolution times. When plans change, communicate promptly and explain the rationale behind decisions. After recovery, share a concise incident report with what happened, what was fixed, and what will be done to prevent recurrence. Transparent communication helps protect trust even when the system is unreliable.
The SoftLinked perspective on readiness and resilience
From a practical standpoint, the SoftLinked team emphasizes structured playbooks, automation, and ongoing drills as the core of resilience. Regularly review playbooks, automate common remediation steps, and measure your incident response against defined SLIs and SLAs. A mature incident program reduces downtime, shortens incident windows, and improves customer satisfaction even in challenging outages. By treating downtime as an engineering problem with repeatable, auditable steps, teams can recover faster and learn continuously from each event.
Steps
Estimated time: 1-2 hours
- 1
Identify outage scope
Confirm the incident is real, determine affected services, and establish a temporary incident commander. Capture initial metrics to guide triage and communicate scope to stakeholders.
Tip: Lock down changes that could worsen the outage until a fix is validated. - 2
Check health dashboards
Review service health, error budgets, and recent incidents. Compare current metrics to baseline to spot anomalies and prioritize fixes.
Tip: Share a rapid update with on-call staff every 15 minutes if the outage is ongoing. - 3
Audit recent changes
Scan deployment logs, feature flags, and configuration changes for the last 24 hours. Look for rollback points and changelog updates.
Tip: If you find a suspicious deploy, prepare a rollback plan with rollback scripts. - 4
Isolate and test components
Use health checks, traces, and logs to identify the failing component. Disable non-essential paths to stabilize the system.
Tip: Avoid sweeping fixes; test isolation in a staging-like environment when possible. - 5
Apply remediation
Implement the chosen fix (rollback, restart, scale, or reconfigure). Validate service recovery with end-to-end tests and user-visible checks.
Tip: Document exact actions taken for postmortem analysis. - 6
Verify recovery and communicate
Confirm services are back to baseline, monitor for recurrence, and post a clear incident report with root cause and prevention steps.
Tip: Share a customer-facing update with current status and next steps. - 7
Postmortem and improvement
Conduct a blameless postmortem to identify gaps in runbooks, alerts, and resilience. Update documentation and runbooks accordingly.
Tip: Assign owners for each preventive action and schedule follow-up reviews.
Diagnosis: Users report elevated error rates and degraded performance; the service is down or partially available.
Possible Causes
- highPower or network outage at data center
- highFaulty deployment or misconfiguration
- highDatabase or cache failure
- mediumDependency service outage (external API)
- mediumDNS or load balancer misrouting
- lowResource exhaustion (CPU/memory)
Fixes
- easyCheck data center status and power feeds; confirm network connectivity to all regions
- easyReview recent deployments and roll back if needed; re-apply a known-good configuration
- mediumRestart or scale database clusters; verify replication and backups
- mediumTest and isolate external dependency calls; implement fallback paths or cache results
- easyValidate DNS records and health checks; reset load balancers if misrouting is detected
- easyInspect system resources; scale up or throttle traffic to prevent cascading failures
Your Questions Answered
What is the first thing I should check when software is down?
Verify the outage is real by checking status dashboards, error budgets, and user reports. Review recent changes and health endpoints to identify the scope quickly.
Start by checking status dashboards and recent changes to confirm the outage and scope.
How can I tell if the issue is deployment-related rather than infrastructure?
Look for recent deployments, canary releases, and error patterns aligned with the rollout. Compare current metrics with baselines to spot deployment-induced faults.
Check deployment logs and recent changes to differentiate deployment issues from infrastructure faults.
When should I escalate the incident to leadership or vendors?
Escalate when the outage lasts beyond defined SLAs or significantly impacts customers. Prepare a concise incident summary for leadership and vendors.
Escalate if the outage continues past your defined thresholds.
What are common mistakes during outages that worsen them?
Avoid not communicating, skipping essential health checks, and attempting untested hotfixes without rollback plans. Document every change during the incident.
Don’t skip checks or run untested fixes without a rollback plan.
How can we reduce downtime in the future?
Invest in robust monitoring, fault-tolerant architecture, chaos testing, and clear incident runbooks. Regular drills help teams respond faster.
Focus on monitoring, resilience, and practiced runbooks.
Watch Video
Top Takeaways
- Start with health checks and status dashboards.
- Isolate components to identify root causes quickly.
- Follow a structured diagnostic flow to speed recovery.
- Build and practice runbooks to prevent repeats.